BUY SELL INDICATOR
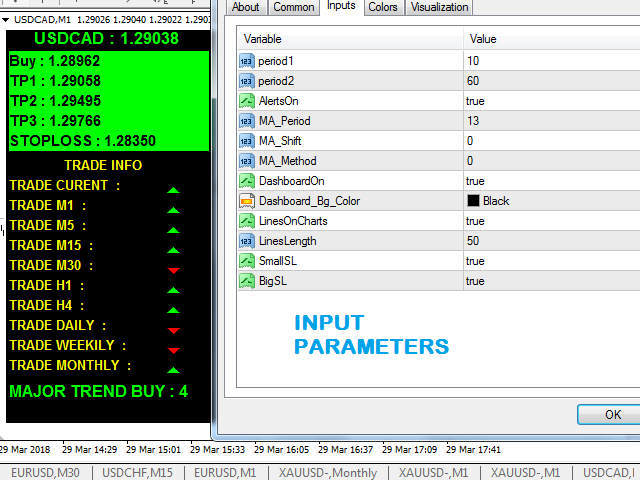
This Indicator Generates Buy and Sell Signals based on 2 Periods of Smooth Moving averages.
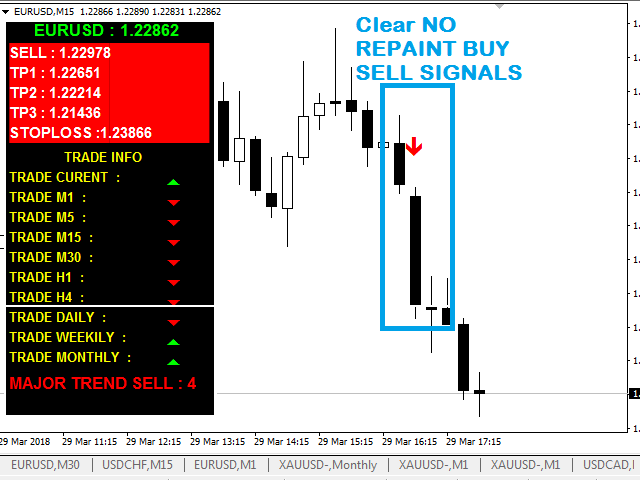
The Buy Sell signals are NON REPAINTING and Generated upon CLOSE of BAR.
The Historical or past Arrows are also visible on charts for detail analysis or back-testing.
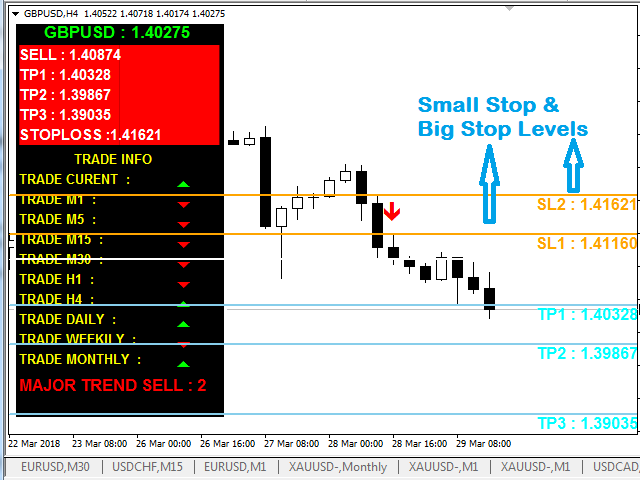
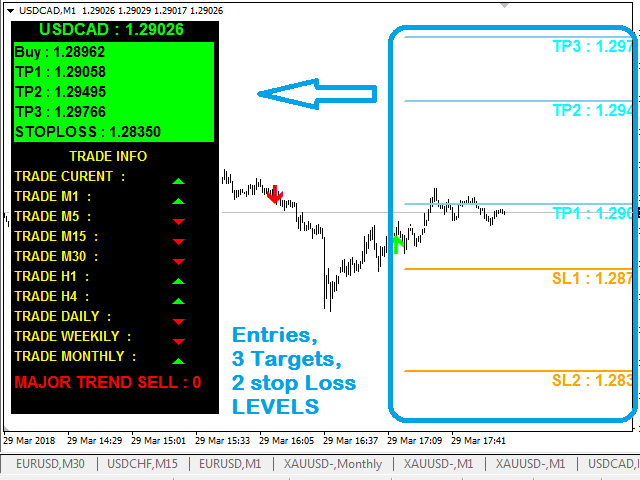
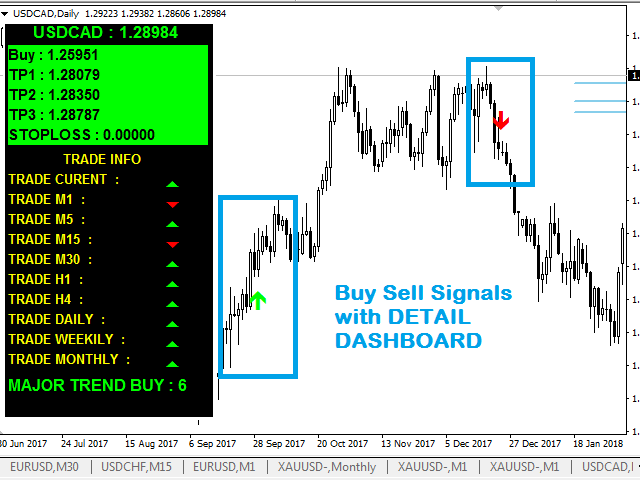
The signals when triggered, also activate the 3 Target levels and the 2 stop loss Levels.
The Entry line is also displayed, and the re-entry can be initiated when the price may reverse again from those levels.
The Stop losses can be selected as per risk-reward ratio, and the smaller or nearer level is advisable for short-term trades while the bigger or farther level for the swing trades.
The Pop Up Alerts – provide complete details of Entry Symbol, and chart Time frame and the Price, so no need to be watching all the charts.
The Sensitivity of the Buy and sell signals can be adjusted by increasing ( reduces the number of signals) and reducing ( increases the number of signals).
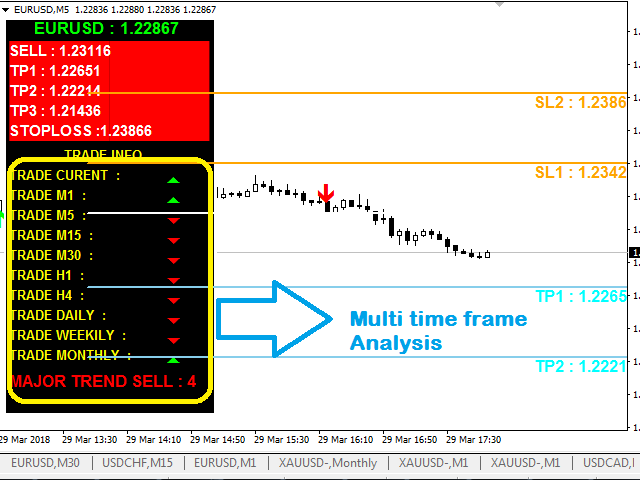
The Dashboard panel TOP AREA- displays all details of the TRADE like ENTRY, TARGETS, AND STOP LOSS LEVELS.
The Dashboard panel LOWER AREA – displays the MULTI-TIME FRAME – TREND ANALYSIS, in a graphical way and also the MAJOR OR MINOR TREND IS CONCLUDED.
The multi-time frame analysis is to be used as a filter to ENTRIES, and only when at least 50 percent or more of the higher time frames are in favor of the entry direction, will the confirmed entry be taken
GALLERY