MULTI -TIME FRAME TREND ANALYSER
INDICATOR TO SHOW THE TOPS AND BOTTOMS OF THE MARKETS.
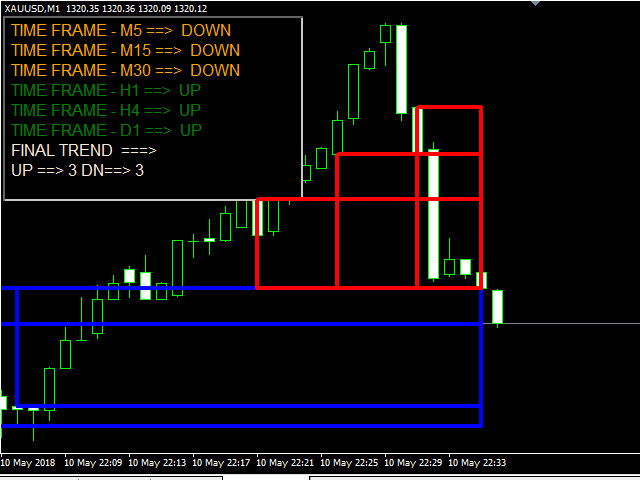
Graphical Analyses – For 6 Time Frames (Customizable)
The 6-time frames Can be set to requirement.
A MUST HAVE Professional tool for getting a graphic display of the complete market trends.
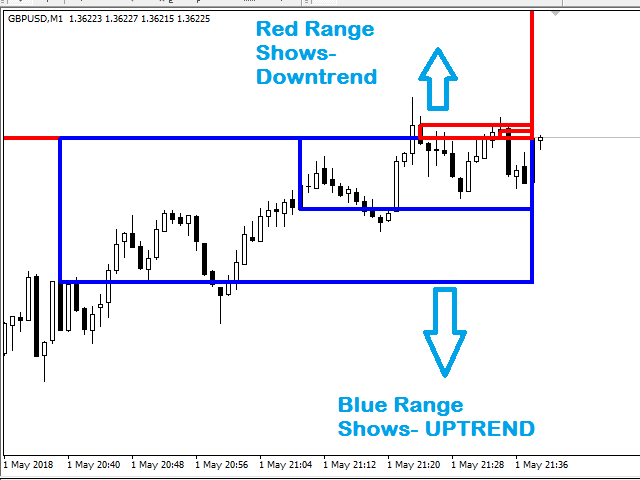
The Indicator helps in simple and effective ways to see what each time frame is doing- bullish or bearish.
The trader just needs to know about this and he is well equipped to take a high consistency trade.
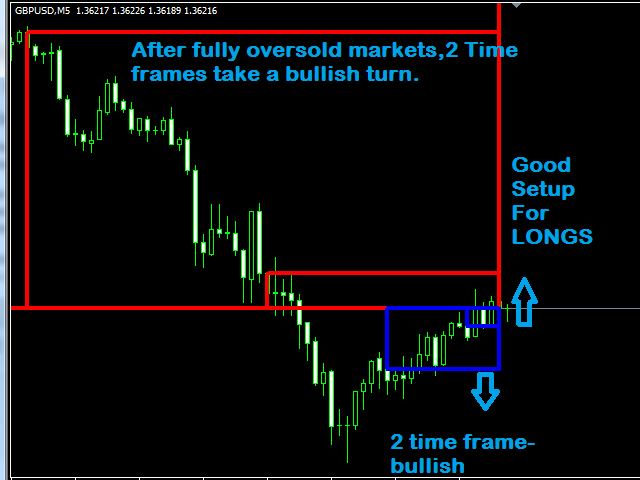
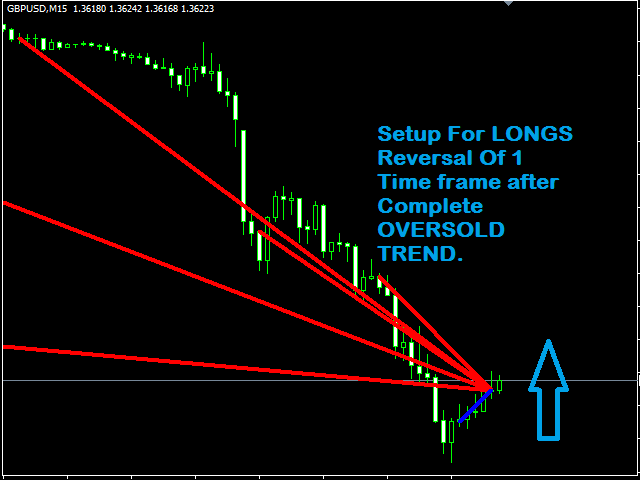
When all the higher time frames have turned bullish means it is highly overbought and then there is the best possibility of selling at TOPS.
THE indicator- CAN SHOW tops and bottoms of markets.
INPUTS
Multi Time Frame Settings
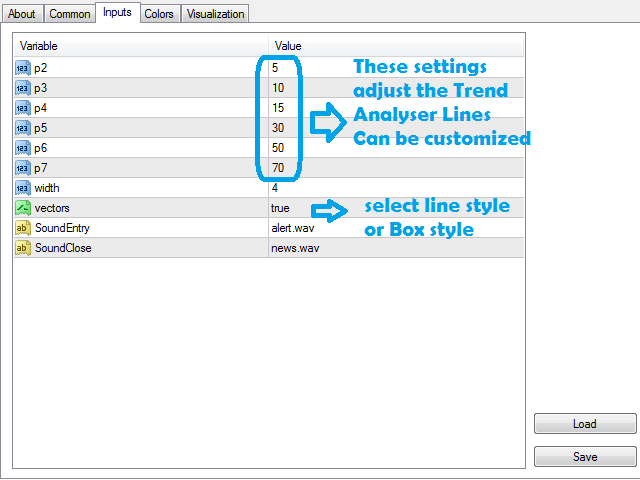
- p2 = 5; – Period (in Minutes) of time frame to DISPLAY the trend
- p3 = 15;-Period (in Minutes) of time frame to DISPLAY the trend
- p4 = 30;-Period (in Minutes) of time frame to DISPLAY the trend
- p5 = 60;-Period (in Minutes) of time frame to DISPLAY the trend
- p6 = 240;-Period (in Minutes) of time frame to DISPLAY the trend
- p7 = 1440;-Period (in Minutes) of time frame to DISPLAY the trend



Display Settings For The Trend Lines / Trend Boxes
- width = 4;-Thickness of the Trend Lines/ranges For the Multi Timeframe Trends display.
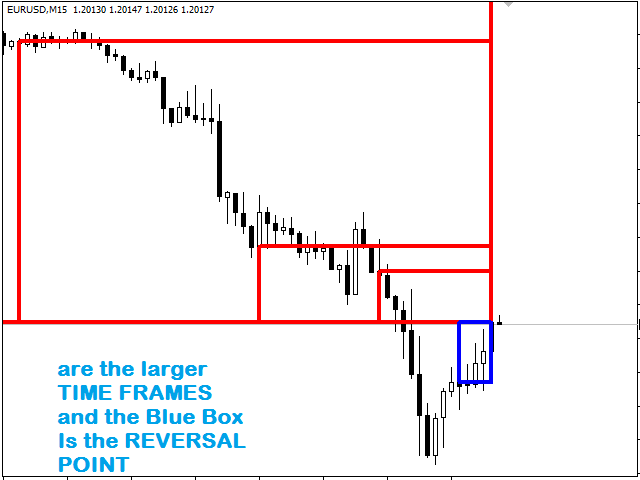
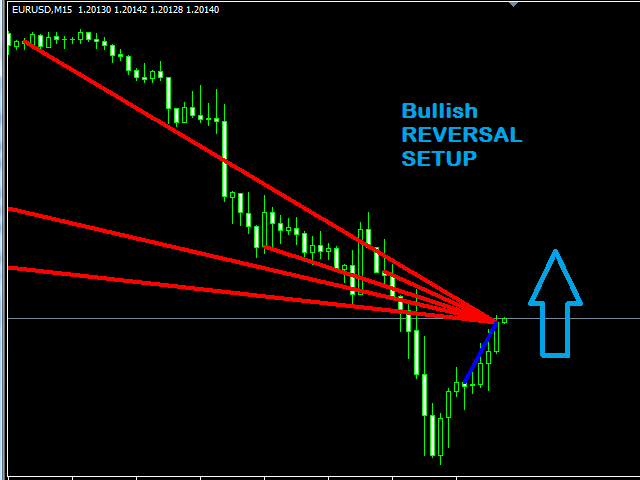
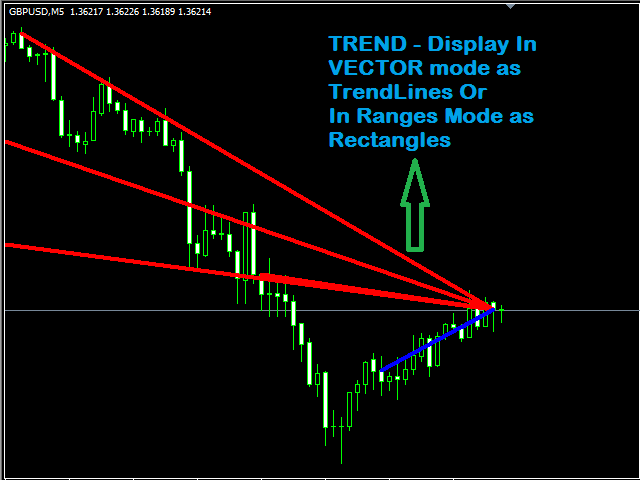
- vectors = True;- Enable Display as Trend Lines, FALSE- enables display as Rectangle Boxes.
Alert settings
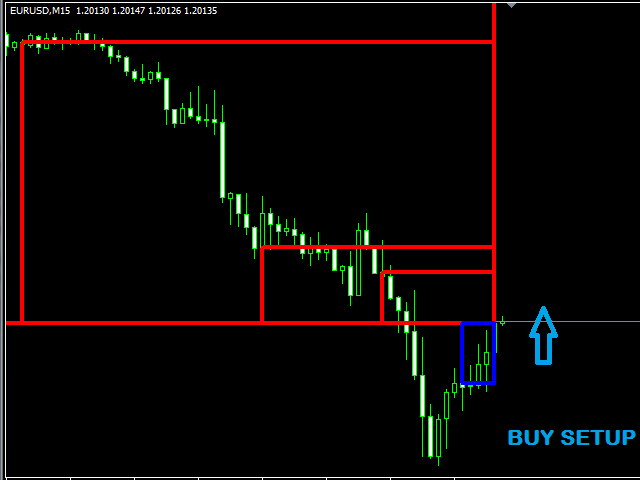
- SoundEntry = “alert.wav”;- ALERT sound- when a REVERSAL TREND IS FORMED.
- SoundClose = “news.wav”;- ALERT sound -when a REVERSAL TREND IS OVER.
