")


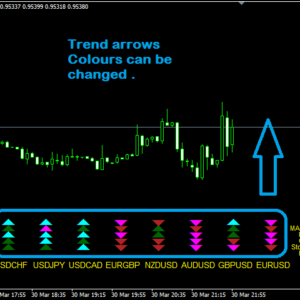
Indicator Dashboard- calculates the strength of all markets , currency pairs , commodities .
Using a proprietary logic. This data can be used to judge and take decisions whether to buy or sell them.
If the particular market is strong means it is bullish , and also the related pair of that market is strong then it will be highly probable that there will be rise in that .
Same way if weak will fall.
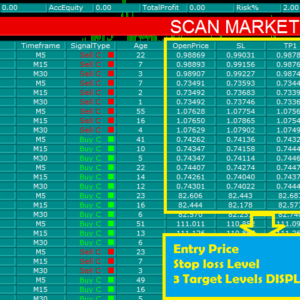
It also provides the entire global markets view at a glance and also the exact level in weak and strong percentage basis , same way if they are just moving in a tight range then they reflect as RANGE BOUND.
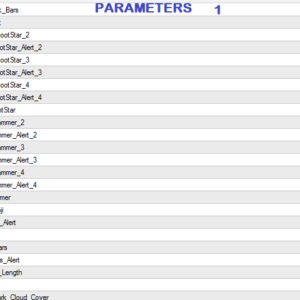
The levels of the strength can be changed from inputs in case required.
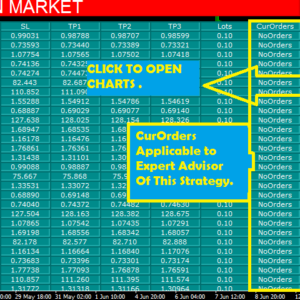
So by looking at the highlighted green and red zones of strong and weak, the trades can be taken accordingly.
Apply stop loss and all risk management and money management tools .

Reviews
There are no reviews yet.